
Grafiken sind für die Augen, Sonifikationen für die Ohren: Mit dem DataSonifyer kannst du ganz einfach Datensätze in Melodien verwandeln – zum Beispiel den Klimawandel.
Global warming due to climate catastrophe has increased rapidly in recent decades. In 2022, for example, Europe experienced the hottest summer seit Beginn der Aufzeichnung, extreme Wetterereignisse wie Waldbrände oder Flutkatastrophen sind eine direkte Folge der Erwärmung. Seit etwa Mitte des 19. Jahrhunderts liegen Aufzeichnungen über Temperaturmessungen vor: anhand dieser Daten lässt sich berechnen, wie stark sich die globale Durchschnittstemperatur in den letzten Jahrzehnten verändert hat und wie warm jedes Jahr im Vergleich zum Durchschnitt zwischen 1901 und 2000 war. Damit ist dieser Datensatz auch reliable evidence of climate change:
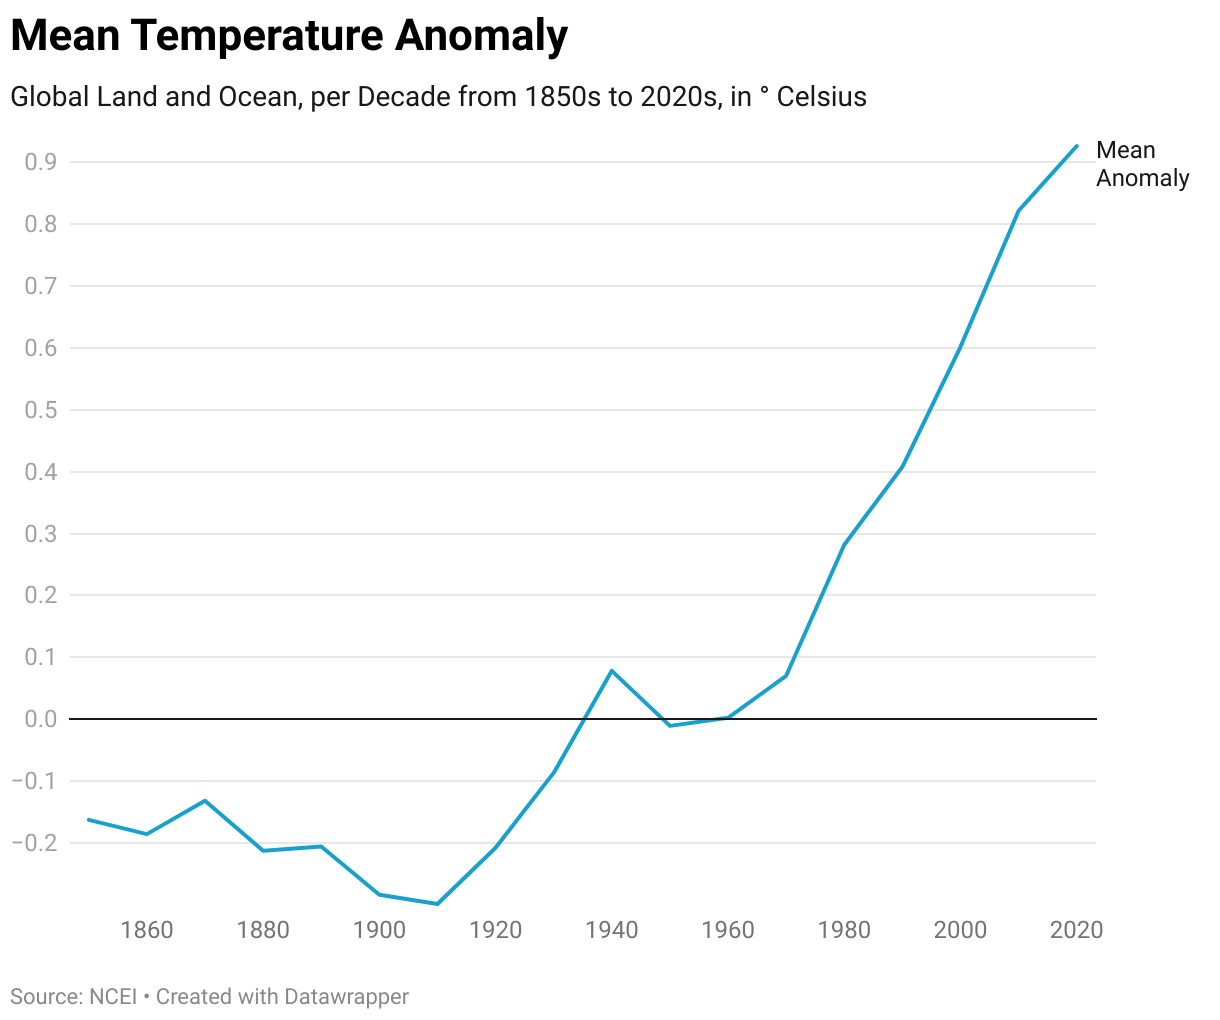
This is the deviation of the annual average temperature from the 20th century average - or in short: global warming, climate change. Visual media can easily use this graph to make the exponential dynamics easier to understand - in auditory media, the numbers can usually only be read out or paraphrased.
What if we could listen to the numbers? For example, as a melody?
Here you can open this preset in the DataSonifyer.
Graphics are visible, sonifications audible: With DataSonifyer you can easily turn data sets into sound. So to speak, a data graphic about climate change you can listen to. This melody can be created with the DataSonifier's "Frequency" module. And it works like this:
1. Download the data and load it into DataSonifyer
Download the numbers from the graph by clicking on "Get the data" below the graph. Now there should be a CSV file ("Comma Seperated Values") in your downl
Then click here to open the DataSonifyer. Click on the "Load Data"-button and select the file. Hit "Ok". Now you need to enter the delimiter of the file - simply enter a comma, i.e. "," without quotation marks and click "ok". The data is now loaded into DataSonifyer!
Auf der grünen Leinwand in der Mitte müsste nun oben links „Year als Tonhöhe“ über einer schrägen Linie stehen – das liegt daran, dass die Daten aus zwei Spalten bestehen: Dem Jahr und der Temperaturanomalie.
2. Set your melody options
Wir wollen aber nicht das „Year“ hören, sondern die „Anomaly“. Melodien kannst du mit dem Modul, auf dem „Frequency“ – also Tonfrequenz – steht, erzeugen. Klicke dort auf das Drop-Down neben „Data“ und wähle „Anomaly“ aus: Das sind die Daten, die wir als Melodie vertonen wollen. Nun hat sich auch die Visualisierung geändert – du siehst ein Abbild der Kurve, die auch auf der Grafik oben zu sehen ist! Wähle jetzt noch unter „Scalemode“ eine Tonart aus, zum Beispiel „C Moll“. Stelle in den beiden Feldern darunter die Oktave etwas höher ein, indem du bei „Min Oct“ 3 eingibst und bei „Max Oct“ 5. Klicke jetzt oben rechts auf „Play“. Glückwunsch, deine erste Sonifikation!
You can speed it up or slow it down by increasing or decreasing the "BPM" value. Let's try 240 BPM, then click on "Play" again - it has now become faster!
If you don't want the sonification to start over and over again, set "Loop" to "Off" right besides the BPM-Input.
3. Record your sonification
You can now use this sonification for your podcast or audio product to listen to the dynamics of climate change in an innovative way. Click "Record" - the DataSonifyer is now ready to record the sonification. Start with "Play", and when you're done, click on "Stop" and again on "Recording". If you scroll down, a new box appears containing "Your Recordings". Here you can download the sonification with a click on "Download as WAV" - aaand done!
4. Experiment with sounds
Also try changing the sound by selecting a different sound source in the drop-down next to "Sound". If the sonification now sounds a little too sharp, click on the "Add Sound Modules" button at the bottom left and select "Filter Control". Click on "Save". Now a new sound module appears, the "Filter"-module. Select "Lowpass Filter" as "Type" and set the filter cutoff frequency to 100 in the "Custom"-Input. Experiment a little with the values and with different sounds.
With each sound module you can control different musical values - either with your uploaded data or with your manual inputs.
The DataSonifyer allows you to sonify your data as pitch ("Frequency"), as volume ("Amplitude"), as tone duration or tone shape ("Envelope"), as rhythm ("Rhythm"), as "Filter" or as "Effect". For each of these musical values, DataSonifyer has its own module. Just experiment with it - help for each of the modules are available with a click on the ♫-button. How would it sound, for example, if you represented the temperature increase as volume and used a randomly generated melody in the Frequency module?